Case Study
Data Sains Dashboard - Analisis Sentimen & Emosi Pemberitaan DIY
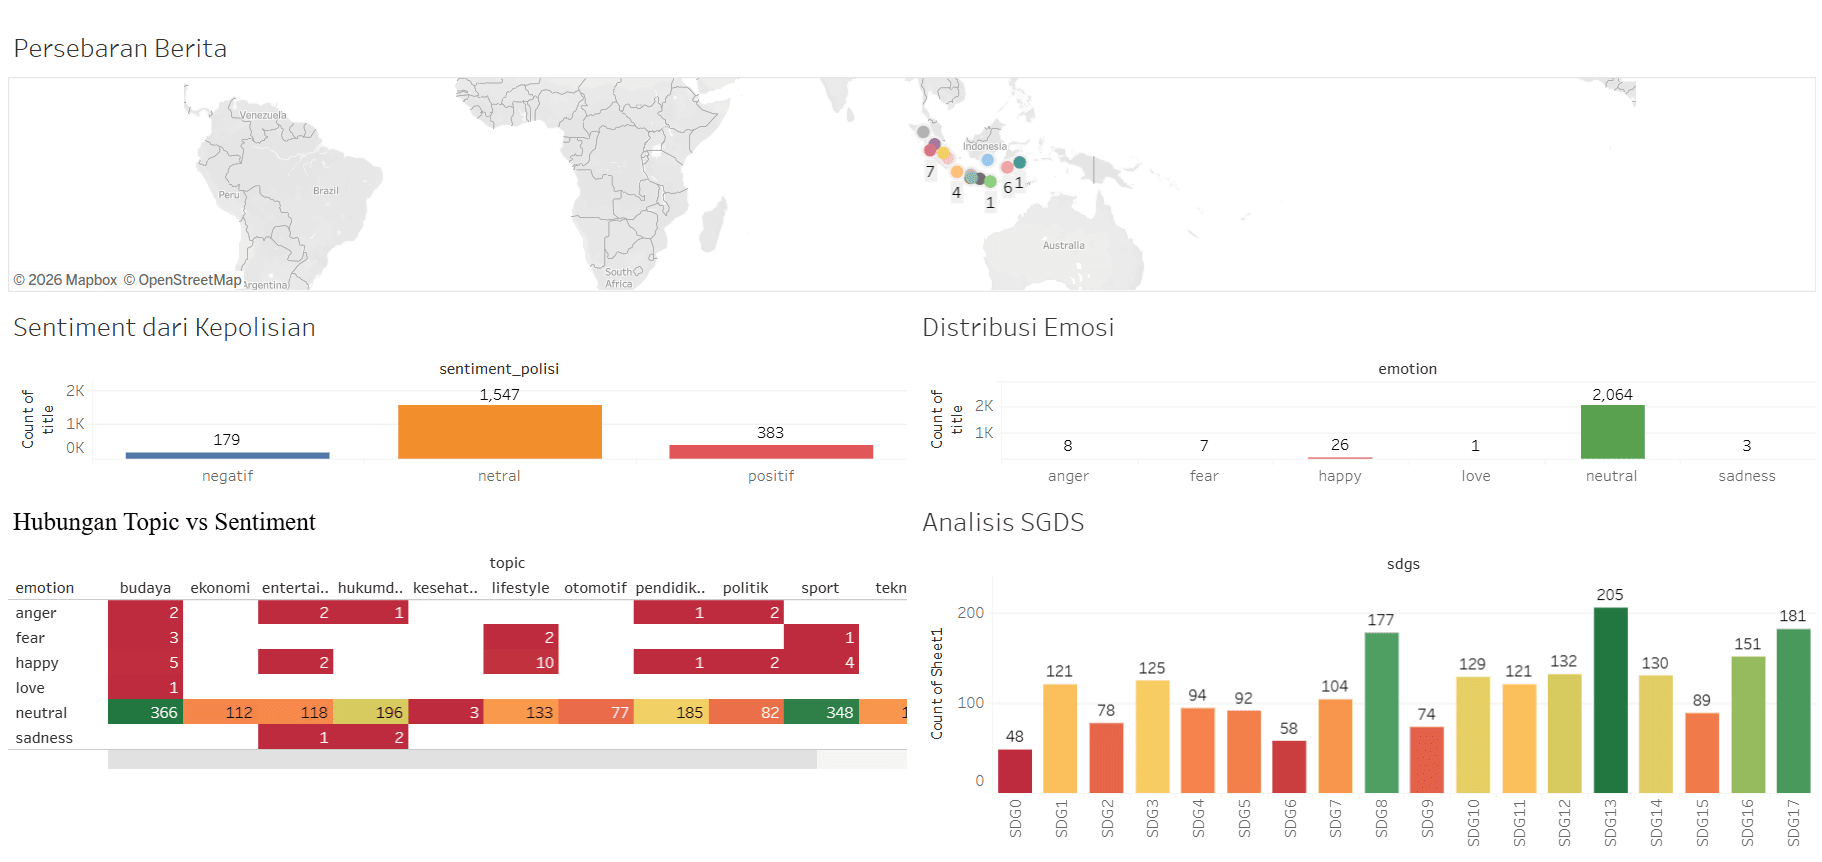
A comprehensive data analysis project using the CRISP-DM methodology to analyze DIY News 2025 dataset. The project covers the full data science lifecycle from business understanding through deployment, resulting in two interactive Tableau Public dashboards. Dashboard 1 provides an overview of news volume, media activity, topic diversity, sentiment distribution, and daily publication trends. Dashboard 2 delivers deep analysis on geospatial news distribution, police-related sentiment, emotional tone analysis, sensitive topic identification, and SDGs relevance mapping.
What I Worked On
My Responsibilities
Business Understanding & CRISP-DM Framework
Defined business objectives, formulated analytical questions, and mapped 10 use cases across the full CRISP-DM lifecycle.
Data Preparation & Cleaning Pipeline
Built Python pipeline to clean 37-column dataset: normalized locations, standardized sentiment labels, converted dates, and handled missing values.
Interactive Tableau Dashboard Design
Designed and published two Tableau Public dashboards with bar charts, line charts, heatmaps, tree maps, symbol maps, and KPI cards for multi-dimensional news analysis.
Business Insight & Recommendation
Synthesized analytical findings into actionable insights for media management, public sentiment monitoring, issue tracking, geographical analysis, and SDGs reporting.
Stack & Links
Built With
Tools, frameworks, and platforms used to ship this project.
Project Links
Screenshots
Project preview carousel
Screenshot 1 / 1